
Estimation of Type A Uncertainty of an Instrument
In the following paragraphs, an example has been cited for justification and calculation of pooled variance from variances taken at different points of calibration of same instrument and also to pool it for several instruments of same kind. The square root of the pooled variance will then be taken as the standard uncertainty from Type A evaluation at all points for the instrument under calibration.
Calibration data of five proving rings have been analyzed. Three proving rings designated as A, B and C are of the same type, each having a dial gauge as an indicating device, while each of the other two proving rings, designated as D and E, is fitted with a six-digit electronic indicating counter, thus having a much better readability in comparison to that of proving rings designated as A, B and C.
Each proving ring was tested at ten points and observations for each point were repeated three times. The variances of three observations at each of the ten points of proving rings are given in Table below.
Abbreviations used in Table BELOW are as follows:
Mean of the variances = Smean
Maximum variance = Smax
Minimum variance = Smin

Mean value of the variance smean, the values of the ratio between the maximum and minimum variances smax/smin and the ratio of the maximum variance with the mean variance smax/smean have been respectively tabulated in the 1st, 2nd and 3rd Mean value of the variance smean, the values of the ratio between the maximum and minimum variances smax/smin and the ratio of the maximum variance with the mean variance smax/smean have been respectively tabulated in the 1st, 2nd and 3rd.
Fisher’s F test [3] has been applied to test the hypothesis that variances under test belong to the same population. The degrees of freedom for variances at each of ten points are only 2, while degrees of freedom for the mean variance are 20. The values of variances show a wide range though the application of Fisher’s F test indicates that none of the variances in any of the five proving rings is outside the limit of 1% level of significance. Limiting value of F at 1% level of significance for 2 degrees of freedom (Table A.8) for each variance is 99.0. Further Limiting value of F at 5% level of significance for 2 degrees of freedom (Table A.7) is 19.0. Comparing the ratios of maximum and the mean values of variances in the set indicates that none of the maximum variance is outside the limits even at 5% level
of significance for rings A, C and E and at 1% level for rings B and D, as the value of F for 2 and 20 degrees of freedom is 3.49 at 5% and 5.82 at 1%. The ratios of mean variances for A, B and C proving rings show that all mean variances belong to the same population at 1% level of significance. It may be noticed that ratio of mean variances of proving rings E and D is 16.75, which is much larger than the F value of 2.94 for 2/20 degrees of freedom. Hence the two mean variances cannot be said to belong to the same population even at 1% level of significance. As the data analyzed have only two degrees of freedom and the last digit in the data is only an eye estimate, a stray case of wide variation may be neglected.
From the above discussions, it may be safely concluded that
To a layman, the variances are apparently different, giving different uncertainties at different points of the same proving ring, thus confusing the user.
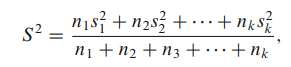
To a statistician all variances, in the set, may be pooled and its square root may be taken as the Type A standard uncertainty.
It is also reasonable to take the average of the variances for similar proving rings to form a pooled variance with larger degrees of freedom. When such a data are accumulated for a year or two, a reliable value of the pooled variance may be established. Square root of this pooled variance may thus be taken as Type A standard uncertainty for future use. Similar process when used for many similar instruments of category II gives a reliable value of pooled variance.
The pooled variance technique is used for a measuring instrument, like balances.
In addition of sensitivity figure of the balance, a pooled variance and standard deviation should periodically be calculated and a record should be maintained.
Similar exercise should be carried out of all measuring instruments and records of the moving average of its variance should be maintained.
Source: measurement uncertainty