An understanding of measurement variation and the contribution that it makes to total variation needs to be a fundamental step in basic problem solving. When variation in the measurement system exceeds all other variables, it will become necessary to analyze and resolve those issues before working on the rest of the system. In some cases the variation contribution of the measurement system is overlooked or ignored. This may cause loss of time and resources as the focus is made on the process itself, when the reported variation is actually caused by the measurement device. In this section a review will be made on basic problem solving steps and will show how they relate to understanding the issues in a measurement system. Each company may use the problem resolution process which the customer has approved. If the measurement system was developed using the methods in this manual, most of the initial steps will already exist. For example, a cause and effect diagram may already exist giving valuable lessons learned about the measurement process. These data ought to be collected and evaluated prior to any formal problem solving.
Step 1
Identify the Issues
When working with measurement systems, as with any process, it is important to clearly define the problem or issue. In the case of measurement issues, it may take the form of accuracy, variation, stability, etc. The important thing to do is try to isolate the measurement variation and its contribution, from the process variation (the decision may be to work on the process, rather than work on the measurement device). The issue statement needs to be an adequate operational definition that anyone would understand and be able to act on the issue.
Step 2
Identify the Team
The problem solving team, in this case, will be dependent on the complexity of the measurement system and the issue. A simple measurement system may only require a couple of people. But as the system and issue become more complex, the team may grow in size (maximum team size ought to be limited to 10 members). The team members and the function they represent need to be identified on the problem solving sheet.
Step 3
Flowchart of Measurement System and Process
The team would review any historical flowcharting of the measurement system and the process. This would lead to discussion of known and unknown information about the measurement and its interrelationship to the process. The flowcharting process may identify additional members to add to the team.
Step 4
Cause and Effect Diagram
The team would review any historical Cause and Effect Diagram on the Measurement System. This could, in some cases, result in the solution or a partial solution. This would also lead to a discussion on known and unknown information. The team would use subject matter knowledge to initially identify those variables with the largest contribution to the issue. Additional studies can be done to substantiate the decisions.
Step 5
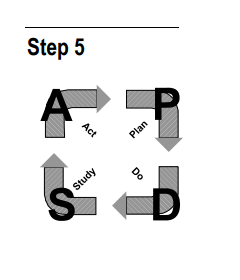
Plan-Do-Study-Act (PDSA)
This would lead to a Plan-Do-Study-Act, which is form of scientific study. Experiments are planned, data are collected, stability is established, hypotheses are made and proven until an appropriate solution is reached.
Step 6
Possible Solution and Proof of the Correction
The steps and solution are documented to record the decision. A preliminary study is performed to validate the solution. This can be done using some form of design of experiment to validate the solution. Also, additional studies can be performed over time including environmental and material variation.
Step 7
Institutionalize the Change
The final solution is documented in the report; then the appropriate department and functions change the process so that the problem won’t recur in the future. This may require changes in procedures, standards, and training materials. This is one of the most important steps in the process. Most issues and problems have occurred at one time or another.
source : Analysis of measurement systems
